DB2
Overview
DB2 is a relational database supporting SQL standards. It also supports JSON data storage and has several functions supporting JSON data interactions.
This tutorial covers the sample data which has JSON columns. It can be loaded by the Qarbine administrator as described in the DB2 configuration document within the Administration documentation area. The concepts discussed apply quite broadly.
Defining a Data Source
Overview
A Data Source is a Qarbine component responsible for retrieving data from somewhere. At a high level it has a name, a description and some arbitrary query string which when sent to the associated Qarbine Data Service endpoint returns some data. The overall execution flow for an analysis, including the optional prompt component, is shown below.

A single data source can be referenced by name from multiple Qarbine template components. This enables a single point of change when perhaps, an index is added, or some other query tweak is necessary. The alternative is to attempt to find all templates impacted by a schema or index change for example. This component reusability is especially beneficial when team members have varying roles and skills.
This data source can be found at “example/IBM/DB2/Sales by region and saledate in 2025”.
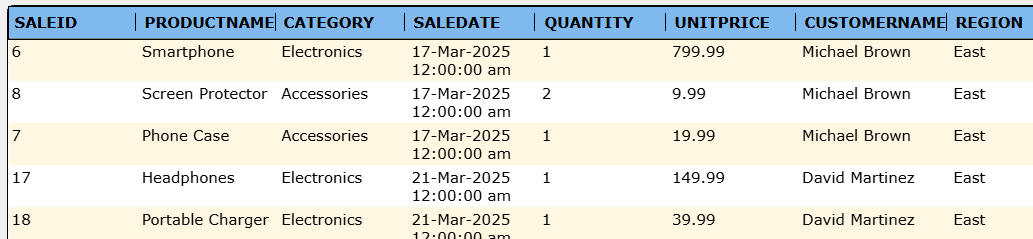
The data source query specification below retrieves sales in 2025.
select *
from SALES
where saledate between '2025-01-01' and '2025-12-31'
order by region, saledate
Sample results are shown below.
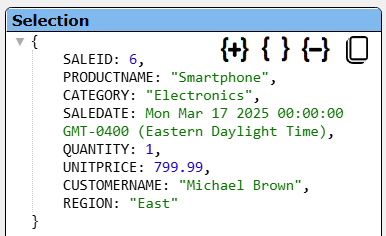
The details of that element are shown below
Managing Answer Set Size
The default maximum number of rows starts off at 25 for a new data source. This is useful to evolve a query from a concept to one that you have verified returns the desired answer set. As noted, any native way of limiting an answer set size is the preferred approach. This setting is in the component dialog as shown below and also accessible by clicking the ‘Gear’ icon.
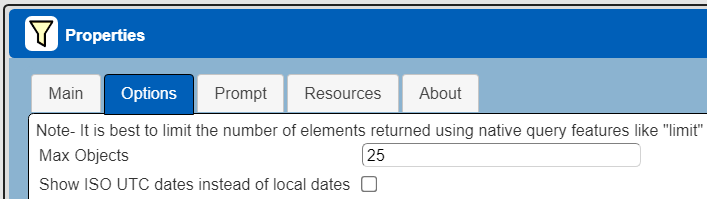
Once you are done drafting you can adjust this parameter. A “0” indicates there is no maximum. A number greater than 0 indicates to limit the final answer set size to that number of rows. This answer set truncation comes after any native query limit. So, if the answer set from the data endpoint is quite large, that content has to be returned to the Qarbine host. It then may truncate the number of rows. It is best to truncate at the query level (i.e., use a limit) to reduce the content sent from the data endpoint to the Qarbine host in the first place.
Adjusting Maximum Rows
Recall the default maximum rows at the component level is 25. When you are satisfied with your query you can change that setting by clicking.

Adjust the setting to “0” indicating no Qarbine answer set truncation.

Click

Prompt Integration
Overview
Qarbine prompts provide a way to obtain runtime values and variables for data source and template execution. To avoid hardcoding, prompts can use macro formulas to run queries which populate list widgets. Prompts are defined in a no code manner using the Prompt Designer. Shown below is the execution flow when there is a Prompt component.

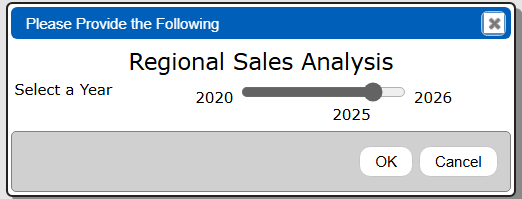
Sample Prompt
The Prompt Designer supports a large variety of input widgets including entry fields, check boxes, radio button groups, sliders, and file input. Shown below is a prompt for single year value.
Clicking

propagates the year variable along to data sources and templates for their consumption.
This Prompt can be found at “example/IBM/DB2/Prompt for year”. The prompt has the following elements.

The second prompt element has these main properties.


Adjusting the Data Source to Use the Prompt
The data source defined above uses a hard coded year. Load that data source and follow the steps below to use a prompted date range instead of a hard coded one.
The following new data source can be found at “example/IBM/DB2/Sales by region and saledate in prompted date range”.
If you load the previously defined data source then immediately do a “Save as” action  to create a new data source. Give it a name such as “Sales by region and saledate in prompted date range”. You will use this data source in the following section describing template definition.
There are 2 main differences from the first data source:
- The query spec has a variable for a year value.
- A prompt is referenced to obtain a year from the user.
The adjusted query specification is shown below.
select *
from SALES
where saledate between [! format(@dateStart, 'date', 'YYYY-MM-DD') !]  and [! format(@dateEnd, 'date', 'YYYY-MM-DD') !]
order by region, saledate
DB2 syntax for the date is a 4 digit year, a dash, a 2 digit month, a dash, and a day of the month value. To format there we use the “[! … !]” syntax which contains a macro expression. FOr the year 2025 the resulting query is
select *
from SALES
where saledate between '2025-01-01’ and '2025-12-31’
order by region, saledate
Associated the prompt by first clicking  to open the properties dialog.
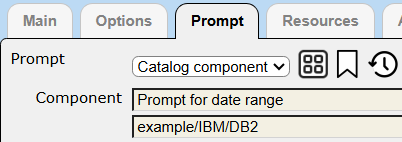
Activate the Prompt tab.

Choose the drop down option shown below.

Since the prompt was just defined use the recents dialog button  to choose the prompt reference. The desired result is shown below.
Save the data source updates by clicking

Defining an Analysis Template
Overview
A template defines how to process the data being retrieved from Data Source queries and other data expressions. It also defines formulas, formatting options, and other analysis and presentation options. The overall execution flow for an analysis, including the optional prompt component, is shown below

Using the Template Designer
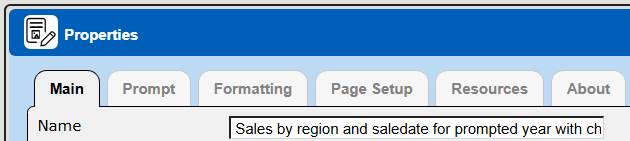
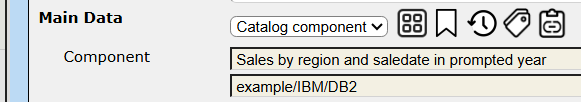
This template can be found at “example/IBM/DB2/Sales by region and saledate for prompted year with chart”.
The output from the template starts with a summary chart as shown below.
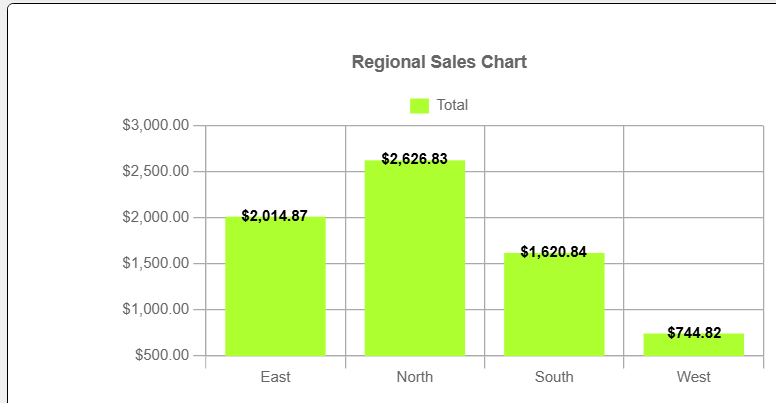
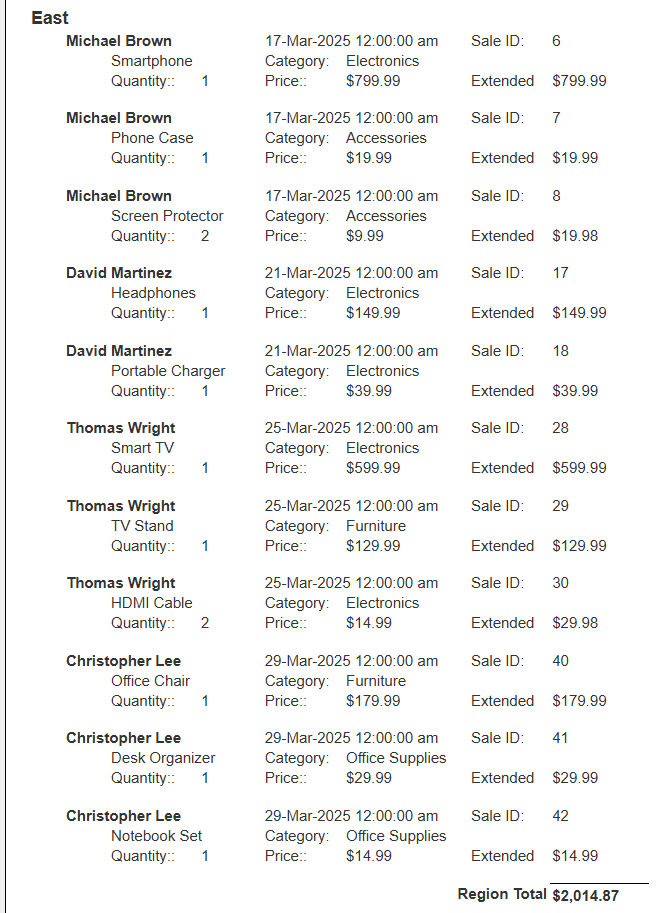
This is followed by the details grouped by region with a total for that region.
Review its properties by clicking on .
Notice it is associated with the data source defined above. Recall that data source is associated with the prompt described above as well.
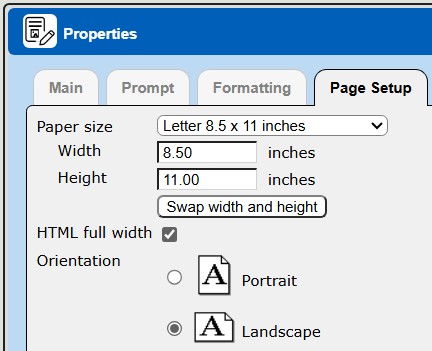
The formatting options are shown below.


The page layout properties are shown below.
The general layout of the template is shown below.
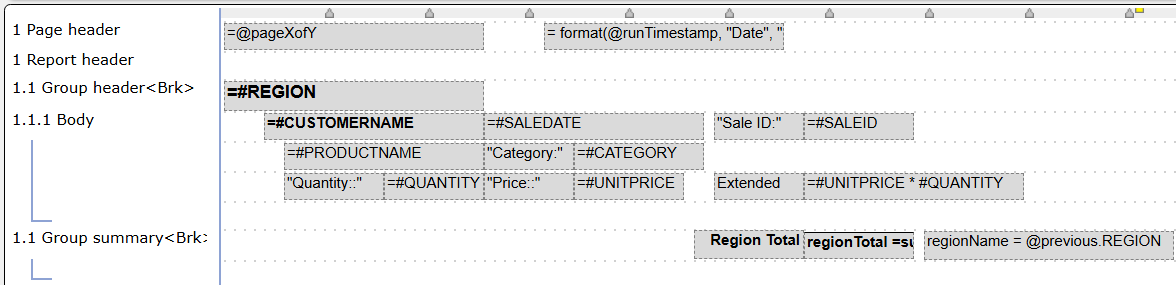
Each answer set row contains the REGION column value. We do not want to redundantly display that so we place the REGION value on the group header and then specify a break condition as shown below.

The body cells use basic Qarbine formulas with the ‘#’ prefix indicating a column value of the current row. The extended price is calculated using the formula
The group summary cells are summarized below.
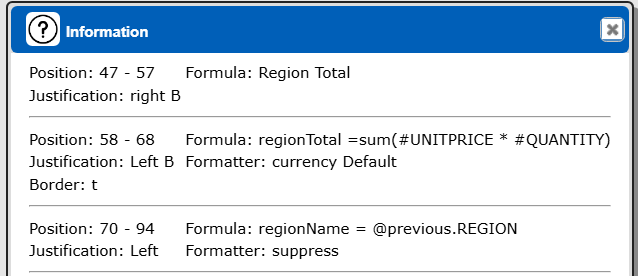
Note the regionName cell has suppressed output. Its purpose is to save the region name for use by the chart’s label formula.
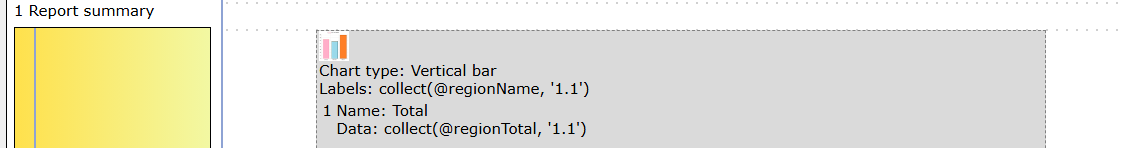
There is a chart on the report summary line. Its properties are shown below.


The labels and date expressions collect the current values of the regionName and regionTotal variables. These formulas fire when processing is on the group 1.1 summary line.
The regional total values are formatted based on the following settings.


The report summary is forced to start on another page by selecting the lene in the left hand area and specifying the following.

Finally, to have the report summary chart appear at the start of the report, the following is checked.


Next Steps
Querying Your Database
For database specific interaction guides navigate to
http://doc.qarbine.com/docs/category/data-source-designer